
Executive summary
- China equities seem poised for a sustained uptrend.
- It is prepared to defend its growth targets and do “whatever it takes”.
- Ongoing stimulus and policy commitment are driving the gains – its policy strategies appear to be effective.
- Amidst global shifts, China remains a leader of the largest remaining free-trade bloc.
- China’s solid earnings growth, export competitiveness, fair valuations, and rising liquidity are supportive factors.
We first suggested in Q4 24 that China’s stimulus could unfold as the “whatever it takes moment” for investors because government support is so large and targets key areas of deflation stress to help boost corporate profitability1. Furthermore, with the passage of time there may now be too much credibility at stake for ‘policy failure’ to be acceptable: China’s equity returns ended 2024 much stronger than many expected2, and 2025 YTD MSCI China is tracking (USD) gains of 21%3.
China’s policy strategies are paying dividends – equity returns are rising with robust growth
China’s industrial upgrading initiative is focused on shifting output increasingly toward higher value-added products, with greater productivity and automation. China already leads the world, alongside the US, with the most spending on research and development4. Especially across sectors like Artificial Intelligence (AI) and IT/Communications – China will defend its national interests and enhance its supply-chain efficiencies and security.
With stronger per-capita disposable income growth, China’s policymakers are striving for greater contributions to economic activity from consumption, with supports from investment in infrastructure, housing, healthcare and education. At the same time, social rebalancing efforts seek to improve access to public services and reduce poverty. What is also positive for investors is that China continues to enhance its governance frameworks with regulations and reforms targeted to strengthen market stability, access, and fairness. Even with the global shift toward greater protectionism, China remains a leader of the largest remaining free-trade bloc5.
Putting all these initiatives together, along with China’s largest stimulus since Covid, China’s equity returns are rising with its robust growth (see Figure 1). We have always maintained the view that China will hit its 5% GDP growth target, as set by the National People’s Congress (NPC) for 2024 and 2025. Industrial production growth, the most significant component of the economy, has held-up well, while consumer spending has been patchy, but improving.
While it may take several years of stimulus to resolve the key headwinds to China’s investment performance, there are already significant improvements across fundamentals (i.e growth and earnings), valuations, liquidity, and flows that are fostering a bullish environment for active investment management.
China has solid earnings growth expectations at fair valuations
Consistent with robust GDP performance, China’s expected earnings growth remains solid while valuations are fair (Figure 2). We emphasised in our Q2 25 Fullerton Investment Views that China’s favourable earnings outlook reflects how well the economy is adjusting to the challenging global trade environment6. China will continue to benefit from its significant global market shares in rail, maritime, new energy, IT, medical, and robotics7. China will also likely deepen partnerships across Asia and Europe.
China’s export sector is very competitive which can drive better earnings and returns for investors
Shifts in China’s real exchange rate have now made it one of the most competitive exporters in the world (see Figure 3). That means exporter profitability can be higher than otherwise which can feed-through into equity returns for China corporates. In addition, China’s production-cost deflation may also be helping key sectors (i.e. IT, Retail, Materials, Industrials, and Communications) grind higher net profit margins despite any overcapacity headwinds8.
The rise in liquidity can further boost equity returns
It is very timely action from the PBoC in creating more liquidity at this juncture – because increases in money growth can have a significant leading and positive correlation with stronger share market returns (see Figure 4).
Foreign investment inflows to China remain robust
China’s outperforming sectors at the end of last year were IT, Financials, Communications, and Industrials9. As 2025 has unfolded, investors have continued to seek exposures in China, as capital inflows remain on a steady rising trend (see Figure 5).
Figure 1: China’s equity returns are rising with its robust growth
China equity returns and growth
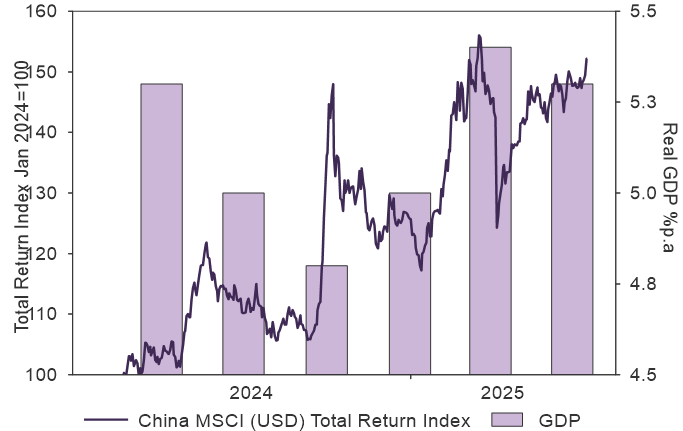
Source: LSEG Datastream, as at July 2025.
Figure 2: China has solid earnings growth expectations at fair valuations
MSCI China
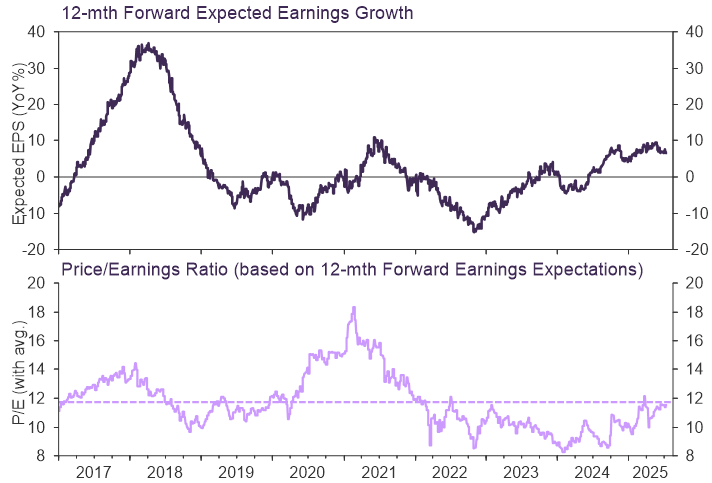
Source: LSEG DataStream as at 14 July 2025.
Figure 3: China’s export sector is very competitive with a low real exchange rate
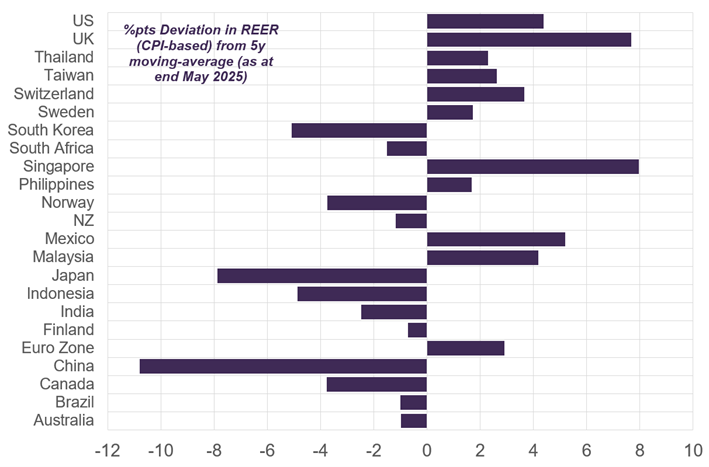
Source: Fullerton Fund Management calculations. LSEG, BIS, July 2025. This is the latest %pts deviation in the real exchange rate (REER, CPI-based) from its trend (a 5y moving-average). The larger the undervaluation the more competitive is the country’s export sector.
Figure 4: The rise in liquidity can further boost equity returns over time
China equities and excess liquidity
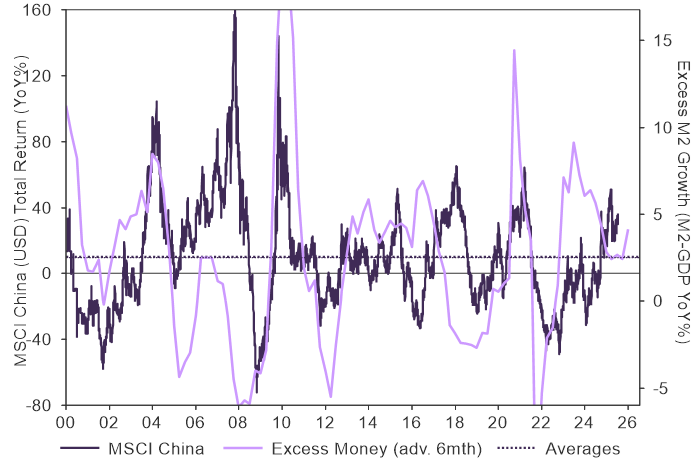
Source: LSEG Datastream, as at 14 July 2025.
Figure 5: Foreign investment inflows to China remain robust
Investment in China
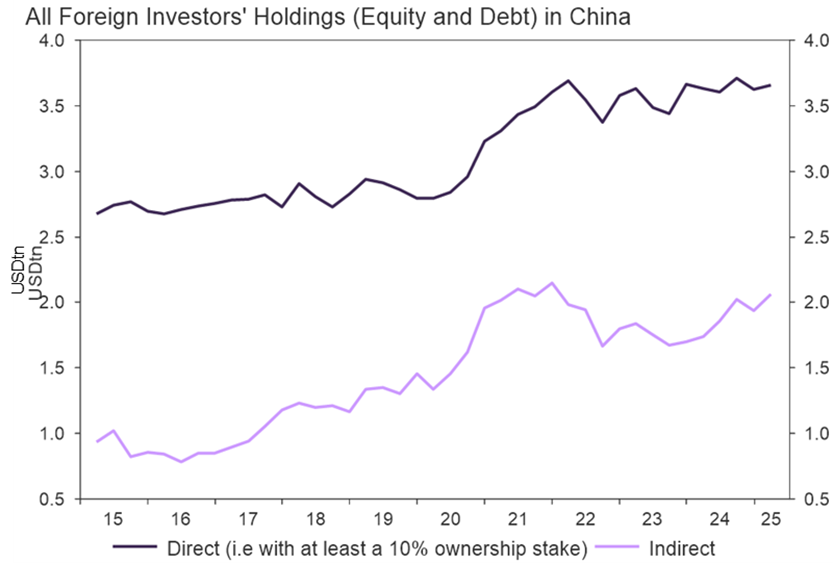
Source: LSEG Datastream, Factset, as of 30 June 2025, Bloomberg.
1 See Asia ex-Japan equity outlook: from positive to bullish – Fullerton Fund Management and Fullerton-Investment-Views-Q4-2024_FINAL.pdf for details. China’s fiscal support package is significant (i.e 6tnCNY/4.5% of GDP) with about half spent already for 2025. There is another 6tnCNY declared by policymakers that could be front-loaded in its deployment in 2026 (or sooner). For monetary stimulus, the People’s Bank of China (PBoC) is utilising all its tools with the objective to boost liquidity to support investor sentiment, encourage more bank lending, and increase housing demand.
2 For 2024: China-A gained almost 15%, MSCI China 20% and China-H shares over 30%. Source: LSEG Datastream, July 2025.
3 “Source: LSEG Datastream, 15 July 2025.
4 In inflation-adjusted (real) terms. Source: OECD and LSEG July 2025.
5 That is the Regional Comprehensive Economic Partnership (RCEP Jan 2022). The agreement is inclusive of around 30% of global GDP across ASEAN, plus Japan, South Korea, Australia, and New Zealand. See: Enterprise Singapore (May 2025).
6 See https://www.fullertonfund.com/wp-content/uploads/2025/04/FIV-Q2-2025_final.pdf.
7 For further background see: https://www.fullertonfund.com/documents/insights/Fullerton_Insights-When_opportunity_knocks.pdf.
8 The data shows a rising net profit margin for these sectors into 2025. Source: Worldscope and LSEG Datastream, 16 July 2025.
9 Source: LSEG Datastream, July 2025.
Important Information
No offer or invitation is considered to be made if such offer is not authorised or permitted. This is not the basis for any contract to deal in any security or instrument, or for Fullerton Fund Management Company Ltd (UEN: 200312672W) (“Fullerton”) or its affiliates to enter into or arrange any type of transaction. Any investments made are not obligations of, deposits in, or guaranteed by Fullerton. The contents herein may be amended without notice. Fullerton, its affiliates and their directors and employees, do not accept any liability from the use of this publication. The information contained herein has been obtained from sources believed to be reliable but has not been independently verified, although Fullerton Fund Management Company Ltd. (UEN: 200312672W) (“Fullerton”) believes it to be fair and not misleading. Such information is solely indicative and may be subject to modification from time to time.
Source: MSCI. Neither MSCI nor any other party involved in or related to compiling, computing or creating the MSCI data makes any express or implied warranties or representations with respect to such data (or the results to be obtained by the use thereof), and all such parties hereby expressly disclaim all warranties of originality, accuracy, completeness, merchantability or fitness for a particular purpose with respect to any of such data. Without limiting any of the foregoing, in no event shall MSCI, any of its affiliates or any third party involved in or related to compiling, computing or creating the data have any liability for any direct, indirect, special, punitive, consequential or any other damages (including lost profits) even if notified of the possibility of such damages. No further distribution or dissemination of the MSCI data is permitted without MSCI’s express written consent.
The audio(s) have been generated by an AI app