
Executive summary
- US software names had an abrupt sell-off in early February on the release of Anthropic’s “Claude Cowork” (specifically Claude Opus 4.6) – an AI tool that could disrupt the Software as a service (SaaS) model of software developers.
- Investors’ reaction has been contained – as seen from the subdued VIX levels, and non-elevated demand for protection (observed from Put/Call ratios on the S&P 500).
- Market participants now are more circumspect given high valuations, with alpha rotations in play.
- Active management would be most apt to capture these opportunities.
What happened?
In the first trading week of February 2026, tech software stocks sold off sharply, on the back of the release of plug-ins to “Claude Cowork” (specifically Claude Opus 4.6) – an AI model by Anthropic, that purportedly can read files, organise folders, draft documents, and handle a large chuck of legal work1. This raised concerns that it may reduce demand for subscription-based specialised software packages, which are typically used by companies to perform such tasks. In short, a possible threat to the Software as a service (SaaS) business model of many of these software firms, which triggered some spillover sell-offs to other tech-related names.
Mild reaction thus far and putting things into perspective
Year-To-Date (YTD) to Feb 10, Asia ex-Japan equities (EM equities) have continued from where they left off in 2025, with strong absolute performances. Developed Market equities (DM equities) have also performed positively, albeit delivering returns thus far that have lagged their EM peers.
Figure 1: Strong Asia ex-Japan equities performance YTD to February 10 (outperforming DM Equities)
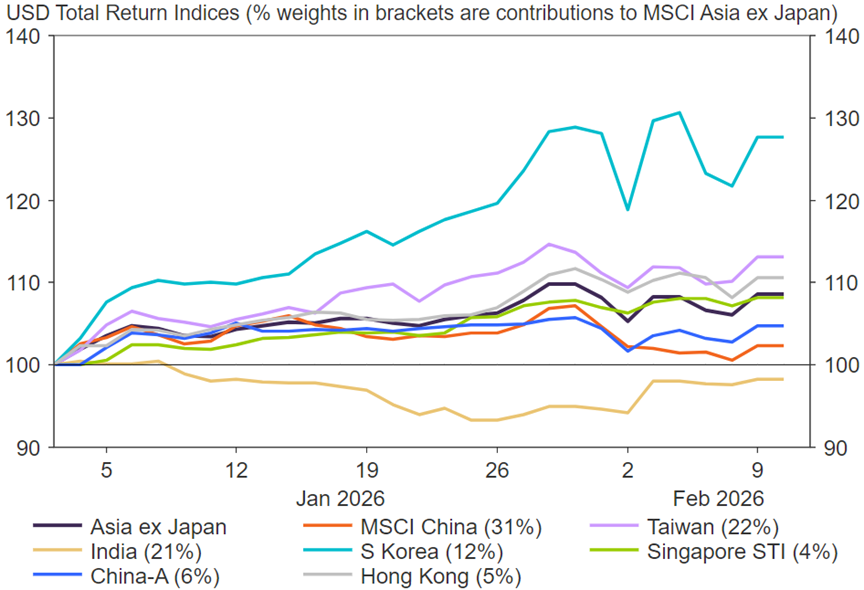
Source: LSEG Datastream, Feb 2026.
Figure 2: Positive DM equities performance YTD to February 10 (lagging EM Equities)
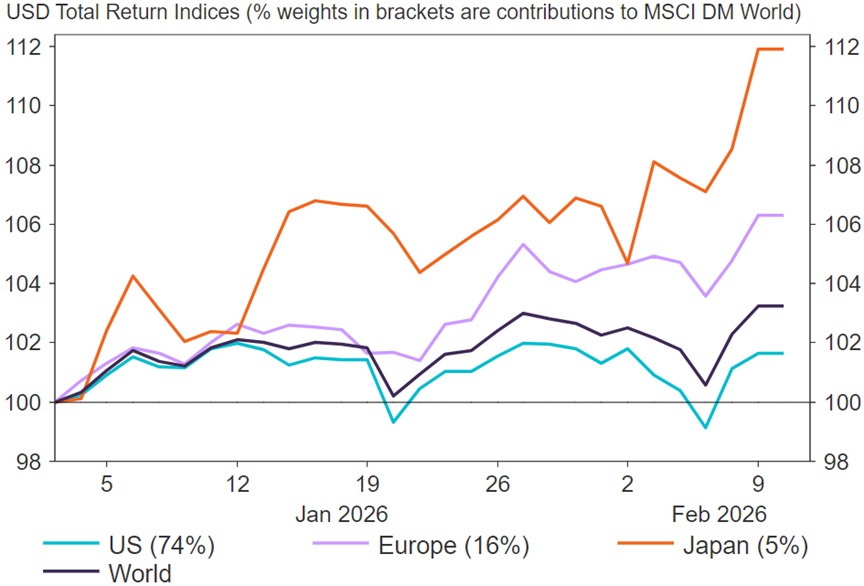
Source: LSEG Datastream, Feb 2026.
After US equities (S&P 500) declined 2.6% from 2 to 5 Feb, the index rebounded 2.0% during Friday’s 6 Feb trading session2. This initial mark down and even steeper sell-off in the MSCI USA / Software Net USD Index (-9.0%) from 2 to 5 Feb (although the software space did rebound 2.5% on 6 Feb)3 was a shock to risk appetite. Perhaps because of elevated valuations and exceptional returns to date, investors are becoming circumspect to any hints of adverse developments. What may be increasingly appreciated by market participants is that everything that is “AI / tech-related” may not continue to sustain strong returns. Returns for some market segments may moderate with rotational plays taking shape.
We do not believe this episode will trigger a derailment of what we believe are strong fundamentals. In some ways it is like the Aug 2024 “flash-crash” clean-out, which was sparked by falls in confidence (and an unwinding of yen carry-trades).
Putting this sell-off into perspective
With most market corrections it is always challenging to judge how significant the forced selling may be, but all the key signposts so far suggest it has not been a key driver. The reaction remains mild. Firstly, US equity market volatility has not been large enough – the “fear” index (i.e. the VIX) has been well contained and much lower than other notable shocks (see Figure 3). Secondly, the demand by investors for downside protection (i.e. the Put/Call ratio), although this has picked up from its lows is still only around average. Thirdly, key global markets are still holding-up reasonably well, like in Asia, Europe, and Japan.
Figure 3: Contained US “Fear” Index and Investor Demand for Downside Protection
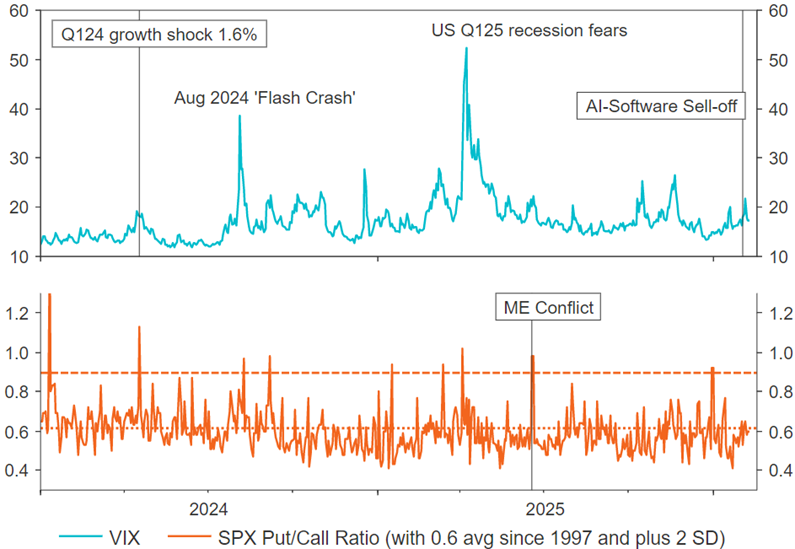
Source: LSEG Datastream, Feb 2026.
Strong fundamentals for investing have not been disturbed
Fullerton emphasised in its Q1 2026 Investment Outlook that global growth (and earnings) remains very strong, with productivity gains, rising incomes, wealth-backed spending, and ongoing policy stimulus, allowing “Global Exceptionalism” to continue creating investment opportunities across many sectors and countries.
• Our 2026 “4Rs” theme frames the key drivers succinctly:
– the AI Revolution,
– with the potential Return of Capital (i.e. policy stimulus and ample liquidity on the sidelines),
– and improving Risk Appetite,
– leading to potentially robust Returns for investors.
• This “Goldilocks” investment environment can favour growth-linked assets like equities and industrial metals.
• However, at the same time, disruption from AI will lead to winners and losers, with spillovers beyond IT.
– there could be other event-driven market volatility over 2026, despite strong fundamentals, making active management crucial for alpha generation.
The best example of investors still taking risk is looking at the alpha rotations underway in key markets – i.e. the US, China, Germany, and Japan – and how much broader it is becoming versus 2025
In the US “smaller sectors” have seen a pick-up in alpha, while across the other markets alpha is quite broad across all the sizes of market-cap.
Potential investment opportunities are stark – a diversified strategy can follow the alpha rotation because sector performance is driven by the ongoing policy stimulus (especially into Industrials and Utilities), the strong fundamentals of growth and earnings, supportive liquidity, and easing inflation.
The US is experiencing alpha rotations toward Energy, Staples, Materials, Utilities, and Real-Estate. Alpha from Industrials and Communications is holding solid. Energy, in particular, is doing well despite soft oil prices because US output has increased significantly, but with lower production costs, which has helped earnings. There is also strong global demand for petrochemicals which have good refining margins.
Figure 4: Sources of Alpha Across MSCI USA
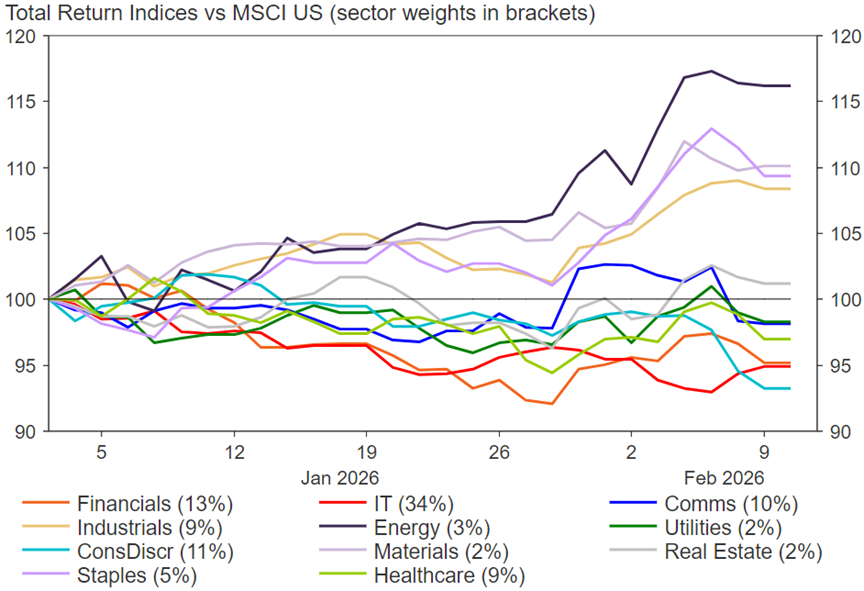
Source: LSEG Datastream, Feb 2026.
For China, alpha is also coming back for Energy (and potentially Real-Estate, but from very weak levels), while the alpha from Materials, Healthcare, and Industrials remains robust.
Figure 5: Sources of Alpha Across MSCI China
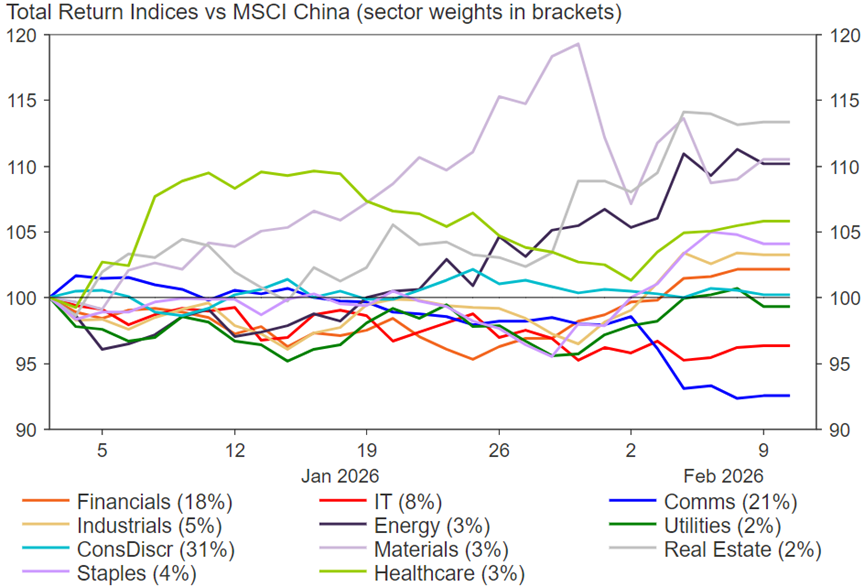
Source: LSEG Datastream, Feb 2026.
Germany continues to benefit from the performance of Utilities, Industrials, Healthcare, Materials, and now Staples. Some of these sectors continue to gain from the large fiscal spending on infrastructure.
Figure 6: Sources of Alpha Across MSCI Germany
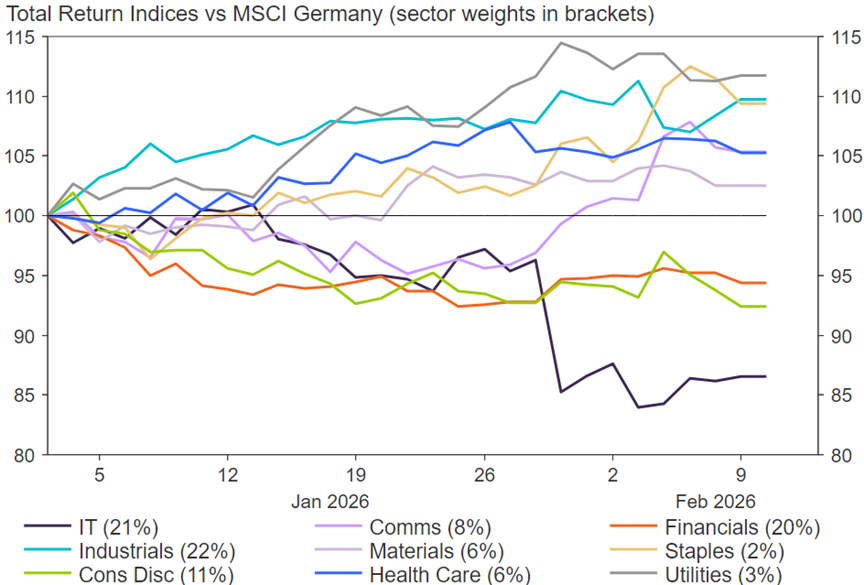
Source: LSEG Datastream, Feb 2026.
Lastly, Japan has experienced alpha rotation to Materials, while alpha remains significant from Energy, Financials, and Industrials, while IT returns have fallen back (but are tracking on par with the market). In aggregate 60% of the market is enjoying significant alpha gains.
Figure 7: Sources of Alpha Across MSCI Japan
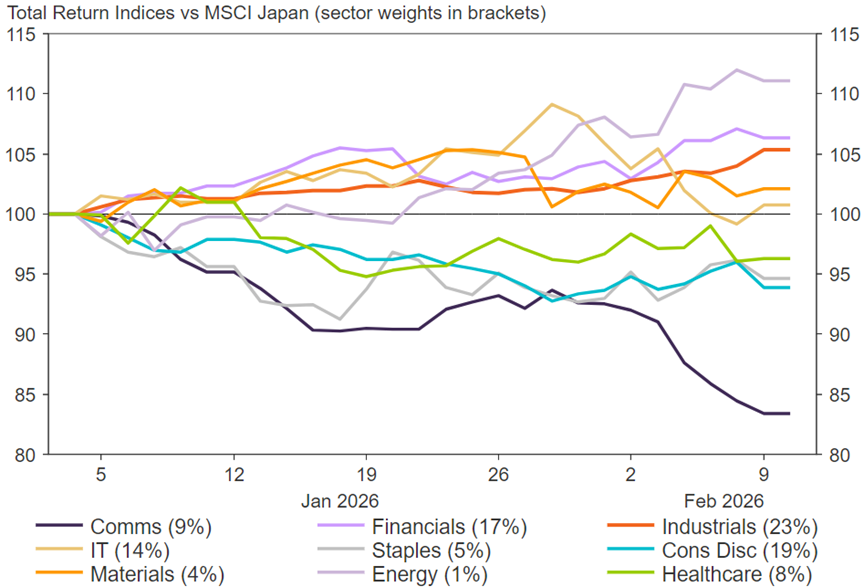
Source: LSEG Datastream, Feb 2026.
1 Source: NDTV World, February 2026.
2 Source: Bloomberg, February 2026 (returns in USD, total return terms).
3 Source: Bloomberg, February 2026 (returns in USD, total return terms). Proxy for MSCI USA/Software Net USD Index (NU119066 Index).
Important Information
No offer or invitation is considered to be made if such offer is not authorised or permitted. This is not the basis for any contract to deal in any security or instrument, or for Fullerton Fund Management Company Ltd (UEN: 200312672W) (“Fullerton”) or its affiliates to enter into or arrange any type of transaction. Any investments made are not obligations of, deposits in, or guaranteed by Fullerton. The contents herein may be amended without notice. Fullerton, its affiliates and their directors and employees, do not accept any liability from the use of this publication. The information contained herein has been obtained from sources believed to be reliable but has not been independently verified, although Fullerton Fund Management Company Ltd. (UEN: 200312672W) (“Fullerton”) believes it to be fair and not misleading. Such information is solely indicative and may be subject to modification from time to time.
Source: MSCI. Neither MSCI nor any other party involved in or related to compiling, computing or creating the MSCI data makes any express or implied warranties or representations with respect to such data (or the results to be obtained by the use thereof), and all such parties hereby expressly disclaim all warranties of originality, accuracy, completeness, merchantability or fitness for a particular purpose with respect to any of such data. Without limiting any of the foregoing, in no event shall MSCI, any of its affiliates or any third party involved in or related to compiling, computing or creating the data have any liability for any direct, indirect, special, punitive, consequential or any other damages (including lost profits) even if notified of the possibility of such damages. No further distribution or dissemination of the MSCI data is permitted without MSCI’s express written consent.
The audio(s) have been generated by an AI app