
US stocks have been a key driver of global equity market returns for several years now as the S&P 500 hit its all-time record high in August 20261.
Large technology companies and the rapid growth in Artificial Intelligence (AI) investment has certainly helped propel the US, and global equities, much higher, but alpha has also been significant from sectors like Industrials and Energy. Fullerton has emphasised that it is vital for investors to appreciate that finding alpha remains a global search. Firms rising to the top of their peer group are driven by productivity-enhanced earnings, investment, and sustained demand. These creative leaders will continue to be found across many different sectors and countries – the US is not a monopoly for investment alpha.
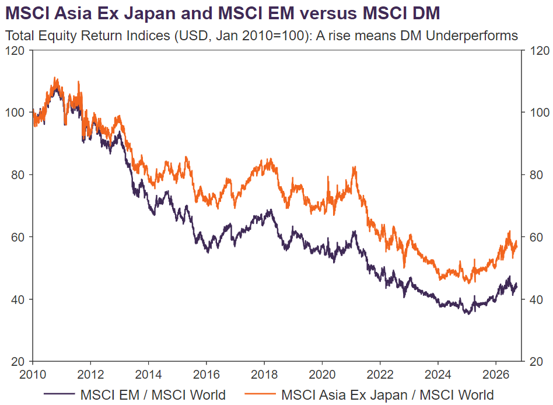
Asia has demanded a closer look by investors for quite a while2, and for several fundamental reasons. Since end 2024 to end August 2026, Asia ex-Japan equities have outperformed US stocks3 – driven by the AI supply chain names in Taiwan and South Korea, to domestic growth opportunities in India, and potential policy beneficiaries in China.
Figure 1: Asia ex-Japan and Emerging Markets outperforming Developed Markets since the start of 2025
Source: LSEG Datastream, September 2026
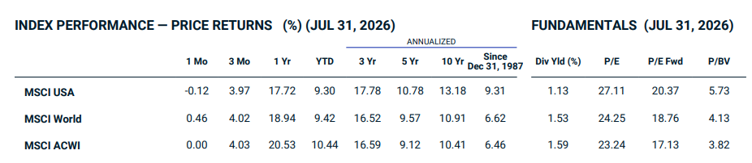
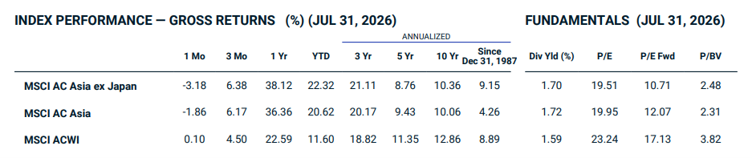
Throughout 2026 valuations have been sliding across most equity markets, from the US to Asia, because earnings expectations (the denominator in valuation measures) have been so strong. US valuations have now fallen back to around their last decade average, while Asia has fallen by more, and this could be an attractive gap for many investors. As of 31 July 2026, the MSCI USA Index was trading at about 20.4 times forward earnings, compared with around 10.7 times for the MSCI AC Asia ex Japan Index.
Figure 2: Price returns of selected DM Equity indices
Source: MSCI USA Index Factsheet, 31 July 2026
Figure 3: Gross returns of selected Asian Equities and Global Equity indices
Source: MSCI AC Asia ex Japan Index Factsheet, 31 July 2026
This does not mean Asian equities will automatically continue outperforming. However, the wider than otherwise valuation gap means Asian equities are trading at a lower than usual multiple of expected earnings compared to US equities.
Fundamentally, earnings performance across parts of Asia have strengthened, supported in part by the region’s role in the AI infrastructure supply chain, and high value-added production and industrial exports.
Importantly, Fullerton’s “Global Exceptionalism” investment theme means this is not an “Asia versus the US” decision. Instead, Asia can offer investors additional sources of growth or potential alpha ideas that complement an existing global or US equity portfolio.
This brings us to an important point: Asia is worth examining in greater detail.
Why Asia could be worth another look?
When thinking about investing in Asia, it can be tempting to focus on whether the region as a whole will rise or fall.
However, the drivers of individual Asian markets can be very different. As it is, the region comprises of varied opportunities across the bloc.
Taiwan and South Korea, for example, have become critical parts of the global AI supply chain. While many companies developing AI models and cloud platforms are based in the US, Asian companies play important roles in areas such as advanced semiconductor manufacturing, memory chips, and electronic components.
We believe supply constraints in areas such as advanced foundry capacity, high-bandwidth memory and semiconductor packaging could continue to support selected companies in Taiwan and South Korea. This has contributed to stronger earnings expectations across parts of the region, particularly within the technology sector.
However, the same exposure has its own risks. Concerns over the sustainability of AI-related capital expenditure and circular finance risk are well flagged – see “Taiwan, South Korea drive Asian equity outflows in July as AI worries bite”.
Nonetheless, Asia’s investment opportunity extends beyond the AI theme.
India, for example, is driven more by domestic consumption, financial services and longer-term structural economic growth factors.
China, meanwhile, has been directing targeted policy support towards areas such as infrastructure, power grids, computing capacity, healthcare and technological self-reliance. We believe these priorities could create opportunities in selected companies, even if they do not lift the broader market uniformly. Most importantly, China’s equity market in 2026 has proved one of the broadest sources of investment alpha globally, with significant investment gains from many of its sectors i.e. Energy, Financials, Healthcare, IT, and Utilities4.
These fundamental features and differences are one reason why active stock selection may be particularly relevant in Asia.
Rather than assuming Taiwan, South Korea, China and India will move together, an active manager can adjust a portfolio’s exposure dynamically as valuations, earnings expectations and company fundamentals evolve.
Below are some examples of how actively managed equity portfolios may potentially add value for investors.
Fullerton Lux Funds – Asia Absolute Alpha: a more flexible approach to Asia
Fullerton Lux Funds – Asia Absolute Alpha aims to generate long-term positive returns from capital growth and income by investing primarily in Asian equities, including up to 35% of its NAV in China A-shares.
What differentiates it from a more conventional regional equity fund is the flexibility it has to manage its overall market exposure.
In addition to equities, the fund can use instruments such as index futures, as well as hold cash and cash equivalents in extreme or adverse market situations. These tools may be used tactically to help preserve capital when market conditions become more challenging.
This gives the fund greater flexibility and speed to adjust its market exposure quickly as conditions change, while retaining exposure to potential upside in Asian equities (as opposed to an arguably more cumbersome sell and buy again later approach).
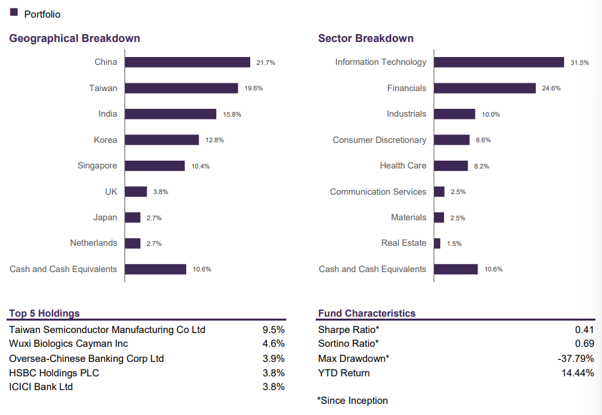
As of 31 July 2026, the fund’s largest geographical exposures were China (21.7%), Taiwan (19.6%), India (15.8%), South Korea (12.8%) and Singapore (10.4%).
Information Technology was its largest sector exposure at 31.5%, followed by Financials at 24.6% and Industrials at 10.0%. The fund also held 10.6% in cash and cash equivalents.
Its five largest holdings were Taiwan Semiconductor Manufacturing Co (TSMC), Wuxi Biologics, Oversea-Chinese Banking Corporation, HSBC Holdings and ICICI Bank.
Figure 4: Portfolio snapshot – Fullerton Lux Funds – Asia Absolute Alpha Class A (SGD Acc)
Source: Fullerton Lux Funds – Asia Absolute Alpha Fund Class A (SGD) Acc Factsheet, 31 July 2026
Over the one year to 31 July 2026, the Class A (SGD) Acc share class returned 26.89% on a bid-to-bid basis. The SGD share class is also available for SRS investment.
Figure 5: Performance snapshot – Fullerton Lux Funds – Asia Absolute Alpha Class A (SGD Acc)
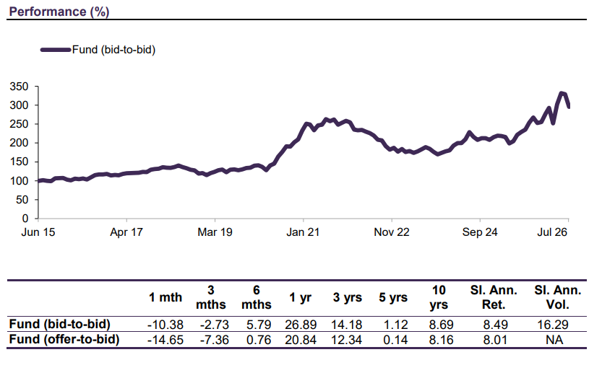
Source: Fullerton Lux Funds – Asia Absolute Alpha Fund Class A (SGD) Acc Factsheet, 31 July 2026. Returns of more than 1 year are annualised. Returns are calculated on a single pricing basis in SGD with net dividends and distributions (if any) reinvested. Offer-to-bid returns include an assumed preliminary charge of 5% which may or may not be charged to investors. Past performance is not indicative of future returns.
Fullerton Lux Funds – Asia Equities: broader participation in Asia’s growth
For investors looking for broader exposure to Asian equities, Fullerton Lux Funds – Asia Equities provides one such potential avenue for consideration.
The fund aims to achieve competitive risk-adjusted returns relative to the market through bottom-up stock selection. It can invest in companies listed across Asia, as well as companies listed elsewhere that derive part of their business revenue from the region, with up to 35% of its NAV invested in China A-shares.
Compared with Fullerton Lux Funds – Asia Absolute Alpha, Fullerton Lux Funds – Asia Equities provides higher exposure to the Greater China, Korean and Indian markets. As of 31 July 2026, its largest geographical exposures were Taiwan (24.3%), South Korea (23.5%), China (20.2%) and India (12.1%).
Its largest sector exposures were Information Technology (42.0%), Financials (18.2%) and Industrials (11.0%). Its five largest holdings were TSMC, Samsung Electronics, SK Hynix, MediaTek and Tencent Holdings.
Figure 6: Portfolio snapshot – Fullerton Lux Funds – Asia Equities Class A (SGD Acc)
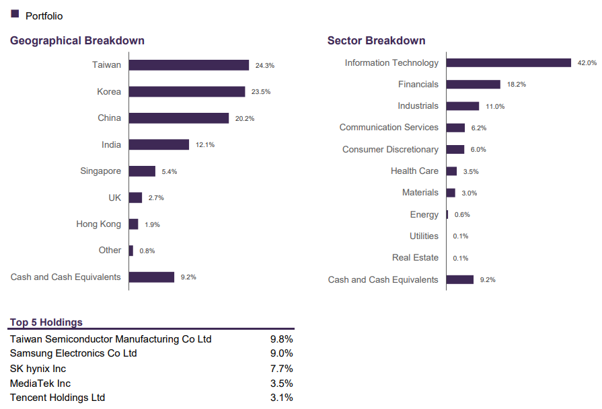
Source: Fullerton Lux Funds – Asia Equities Fund Class A (SGD) Acc Factsheet, 31 July 2026
The portfolio reflects several different growth drivers across Asia that are expressed through various investment ideas. Its positions in Taiwan and South Korea continue to benefit from AI-related demand, particularly across the semiconductor supply chain.
In China, there are opportunities benefitting from a more proactive and targeted policy stance, including investment in areas such as infrastructure, power grids, computing capacity, education and healthcare.
Elsewhere, while higher energy costs have weighed on India, we believe a broadly supportive reform and policy backdrop environment remains the case in the country, and as such, this continues to provide selected opportunities in financials and healthcare.
Over the one year to 31 July 2026, the Class A (SGD) Acc share class returned 39.48% on a bid-to-bid basis, compared with 36.10% for its benchmark (the MSCI AC Asia ex Japan Net Index).
Figure 7: Performance snapshot – Fullerton Lux Funds – Asia Equities Class A (SGD Acc)
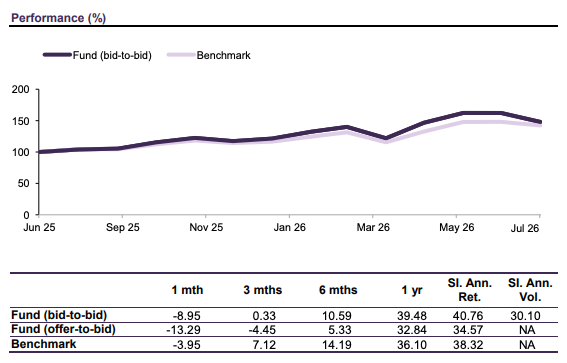
Source: Fullerton Lux Funds – Asia Equities Fund Class A (SGD) Acc Factsheet, 31 July 2026. Returns of more than 1 year are annualised. Returns are calculated on a single pricing basis in SGD with net dividends and distributions (if any) reinvested. Offer-to-bid returns include an assumed preliminary charge of 5% which may or may not be charged to investors. Past performance is not indicative of future returns. Benchmark: MSCI AC Asia ex Japan Net Index.
Fullerton Lux Funds – China Equities: could China surprise on the upside?
After several difficult years for Chinese equities, investor expectations in this space is relatively subdued. With a lower expectation hurdle, could there be room for positive surprises?
China’s economy continues to face challenges, particularly from weak domestic demand and the property sector. However, weaker sentiment can also create opportunities should company fundamentals improve faster than what the market anticipates.
Fullerton Lux Funds – China Equities takes a high-conviction, bottom-up approach to identify individual companies where we see attractive fundamentals, valuations and a sufficient margin of safety buffer.
The fund aims to generate long-term capital appreciation by investing primarily in China A-shares and Hong Kong-listed stocks, with an emphasis on longer-term market developments rather than short-term trends.
The fund’s strategy is valuation-driven, focusing on companies where it believes the market may not fully reflect their longer-term potential. It is actively managed without reference to a benchmark.
As of 31 July 2026, the fund’s largest sector exposures were Industrials (25.2%), Consumer Discretionary (24.9%) and Communication Services (10.2%).
Its five largest holdings were Midea Group, China Mobile, Shandong Himile Mechanical Science & Technology, Haier Smart Home and Hongfa Technology.
Figure 8: Portfolio snapshot – Fullerton Lux Funds – China Equities Class A (USD Acc)
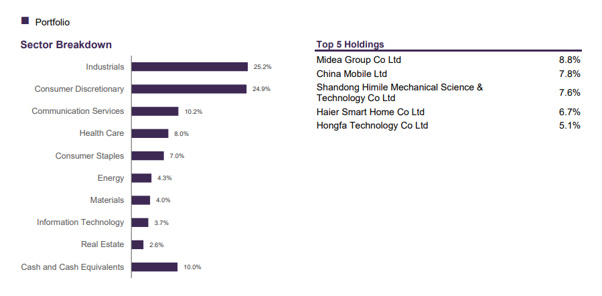
Source: Fullerton Lux Funds – China Equities Fund Class A (USD) Acc Factsheet, 31 July 2026
This makes the fund a more targeted way to access selected opportunities in China, rather than relying on a broad recovery across the wider market.
Over the past one year up to 31 July 2026, the Class A (USD) Acc share class of the fund generated a return of 10.66% on a bid-to-bid basis.
Figure 9: Performance snapshot – Fullerton Lux Funds – China Equities Class A (USD Acc)
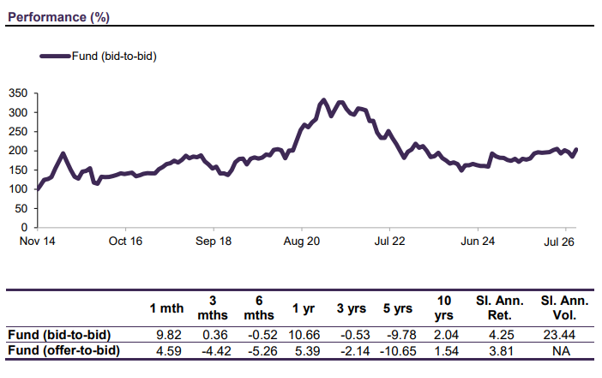
Source: Fullerton Lux Funds – China Equities Fund Class A (USD) Acc Factsheet, 31 July 2026. Returns of more than 1 year are annualised. Returns are calculated on a single pricing basis in USD with net dividends and distributions (if any) reinvested. Offer-to-bid returns include an assumed preliminary charge of 5% which may or may not be charged to investors. Past performance is not indicative of future returns. Benchmark: Prior to 12 Jun 2025, the benchmark is MSCI China A Onshore Net (USD). From 12 June 2025, the fund will be actively managed without reference to a benchmark.
How do the three strategies differ?
The three funds all invest in Asian equities, but they offer different ways to access the region. Their contrast can be summarised below:
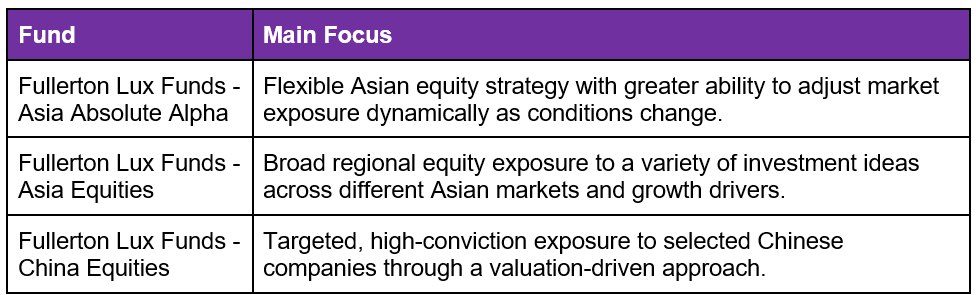
These differences highlight why Asia should not be treated as a monolith single investment bloc. There are diverse investment opportunities across the region that can be accessed through various avenues.
Investors can choose between a strategy with greater flexibility to manage market exposure, one with broad regional exposure to a diverse range of growth drivers (and investment ideas), or a more targeted China allocation approach. Ultimately their selection depends on their investment objectives, risk tolerance, preferences, and market views.
What to watch out for
Asian markets remain sensitive to developments in the global economy.
Taiwan and South Korea’s technology sectors are closely linked to the global semiconductor and AI investment cycle. A slowdown in technology spending or weaker than expected earnings could therefore weigh on these markets.
Performance can also vary significantly across individual Asian markets. China, Taiwan, South Korea and India, for example, are exposed to different economic cycles, policy and market drivers. This means a positive outlook on Asia as a whole does not necessarily translate into similar performance across every market. This is where active management is key.
Currency movements can also affect returns for Singapore investors, particularly when investing through foreign-currency share classes or where the underlying portfolio has unhedged currency exposure.
China carries additional policy, regulatory, economic and geopolitical risks. A China-focused fund also has greater geographical concentration compared to a broader Asian or global equity portfolio.
Finally, all three funds invest primarily in equities and can experience significant short-term volatility. Investors should therefore consider factors such as their risk tolerance and investment horizon before investing.
(Note: Please refer to the respective fund’s prospectuses for the full list of risk disclosures).
Bottom line
The next leg of global market returns could come from different markets and companies as opposed to the leaders of yesterday.
With Asian equity valuations below that of the US and its growth drivers varying significantly across the region, Asia could provide an additional source of long-term growth within a diversified global portfolio.
Taiwan and South Korea offer exposure to the AI supply chain, India has different domestic growth drivers, while China may offer selective positive surprise opportunities where company fundamentals and valuations are attractive.
Asia is not one monolith investment opportunity. The wide difference between countries, sectors and companies means active management and selectivity are critical.
The three Fullerton Lux Funds strategies, Asia Absolute Alpha, Asia Equities, and China Equities, provide different ways to access these opportunities, whether through a more flexible Asian equity strategy, broader regional exposure or a targeted allocation to selected Chinese companies.
Explore Fullerton’s wider range of investment solutions at: https://www.fullertonfund.com/investment-funds/featured-funds/
1 On 13 August 2026 (Source: LSEG)
2 Many positive themes have been building across Asia at least since 2022-23, and Fullerton has done deep-dives into many themes that are still relevant today e.g. FFMC Asia Equities Outlook – from Positive to-Bullish (Nov 2024) and FFMC – “The Asian century: Asia’s rise on the global stage – emerging opportunities and trends”
3 MSCI Asia ex-Japan delivered 68.1% in USD total return terms, while the S&P 500 delivered 33.3% in USD total return terms from 31 December 2024 to 31 August 2026 (source: Bloomberg, September 2026).
4 Source: See pp 18, Fullerton Investment View Q3 2026, for a table of the leading sector sources of equity market alpha for investors in 2026.
Publication date: September 2026.
Important Information:
This publication is for information only and your specific investment objectives, financial situation and needs are not considered here. The value of units in the Fund and any accruing income from the units may fall or rise. Any past performance, prediction or forecast is not indicative of future or likely performance. Any past payout yields and payments are not indicative of future payout yields and payments. Distributions (if any) may be declared at the absolute discretion of Fullerton Fund Management Company Ltd (UEN: 200312672W) (“Fullerton”) and are not guaranteed.
Distribution may be declared out of income and/or capital of the Fund, in accordance with the prospectus. Where distributions (if any) are declared in accordance with the prospectus, this may result in an immediate reduction of the net asset value per unit in the Fund. Applications must be made on the application form accompanying the prospectus, which can be obtained from Fullerton or its approved distributors. You should read the prospectus and seek advice from a financial adviser before investing. If you choose not to seek advice, you should consider whether the Fund is suitable for you. The Fund may use or invest in financial derivative instruments. Please refer to the prospectus of the Fund for more information.
Neither MSCI nor any other party involved in or related to compiling, computing or creating the MSCI data makes any express or implied warranties or representations with respect to such data (or the results to be obtained by the use thereof), and all such parties hereby expressly disclaim all warranties of originality, accuracy, completeness, merchantability or fitness for a particular purpose with respect to any of such data. Without limiting any of the foregoing, in no event shall MSCI, any of its affiliates or any third party involved in or related to compiling, computing or creating the data have any liability for any direct, indirect, special, punitive, consequential or any other damages (including lost profits) even if notified of the possibility of such damages. No further distribution or dissemination of the MSCI data is permitted without MSCI’s express written consent.
Please refer to https://www.fullertonfund.com/use-of-third-party-data-information/ for disclaimers on use of data from third parties.
This advertisement or publication has not been reviewed by the Monetary Authority of Singapore.